Are you a small job shop that needs to get your schedule under control? Don't have tens of thousands of dollars available in your budget for a fancy software package? Do you own a software package and need some tips about what to track?
Below are a couple of simple production trackers you can set up in Microsoft Excel or Open Office Calc. You can set them up by completion dates, or as a Gantt chart. Keep in mind there are a lot of software packages that can help automate this for you, but building it in Excel can help keep your costs down in the short term, and to map out what you need to track if you decide to go with a software package in the future.
Keep in mind that this style of tracker will only be effective if you produce a longer-lead time product common in the engineered products world. If you are doing on demand or allow customers to push in jobs at their leisure, this system will not work. So let's get started building your tracker.
Key Attributes
Regardless of which method you use, both should have the following attributes included in your tracker:
- Include the customer and job number, any any other useful tracking information
- Some plants find it useful to have a separate tracker (or tab) for each value stream in their plant
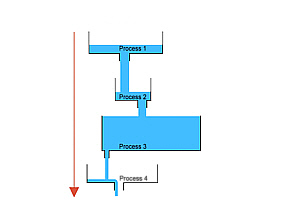
- Have a schedule date for each process, and an actual completion date. This will allow you to know if you are ahead or behind schedule at each process.
- Color in cells that were ahead of schedule or on-time green, and color in cells that are behind schedule red. This will allow you to instantly see where your problems are, and what jobs are in danger of not shipping on-time.
- The completion date is the date or time the LAST piece is complete at that process.
- The tracker should cover the entire order process, not just actual production steps. In fact, ANY input to the system should be tracked.
- Include a column for receiving a PO for your order; it is an input to the process just like materials or labor.
- If you make a custom engineered product, include a due date for drawings.
- You should have at least one, but possibly multiple columns for materials. For example, in a machine shop you may wish to have a due date for steel to come in, and another date for fasteners or off-the-shelf hardware.
- If quality inspection is a long process and requires extensive testing (like custom equipment manufacturers), track the quality process.
- Packaging and shipping operations should be included, with your ship date set to ensure delivery by the customer due date. This is particularly important where loading operations take a long time, such as loading large product on trucks via cranes.
- On the production floor, you should track production at key points, such as when it leaves a department.
- You should include known constraints in your production tracker, and the lead time between the previous process and the constraint will be equal to the amount you have in your drum-buffer-rope buffer.
- You may wish to add useful information to your tracker such as earned hours per job/process, weight/size, special requirements, or a section for notes
Download
Before we examine the two examples, down the production tracker file below in Microsoft Excel. The Date Tracker is the first time, and the Gantt chart is on the second tab.
Production Tracker DownloadCompletion Date Production Tracker
This style of production tracker works well in shops that have a lot of projects and a lot of process steps. It is compact, easy to read, but lacks some of the depth of information possessed in the Gantlet-style charts. Basically an entire job will be in one line, with planned and actual completion dates listed for each process and constraint. Below is a screenshot from the Completion Date Production Tracker:
Green means a project is on-time, red means it is behind, yellow means a special situation, and gray means the process is not needed. Each job outlines a special case. The first job is running green and good to go. The second job has problems in the office, but the shop caught up. The third job is a special situation, while the forth shows what the chart looks like when not all processes are used. The rest of the jobs are still in process, in various stages of completion.
Keep in mind these examples are extremely simplified versions, and your schedule will most likely be much more complicated.
Gantt Chart Production Tracker
The Gantt-style tracker works well will shops that have few jobs on a longer time line that requires greater detail. Gantt charts are a staple of project management throughout the world. The gantt chart does a much better job of visualizing potential constraints and details variation in process time, but can be overwhelming in a busy shop. Below is a Gantt-style production tracker:
The color coding remains the same on the second chart, with the exception of gray, which now details a job still in process. The date on the chart details the planned due date, and if it shaded beyond that date, the job is late. Job one had a maintenance outage that caused the job to go late, but the shop was able to bring it back on track. The second job is on-time, and the third job had massive problems due to unplanned processing being required and will probably be late to the customer.
This type of chart offers a superior view at process times and overall a good visual representation of the flow of the project. However, it may be overwhelming and difficult to track when you have hundreds or even thousands of jobs a month.
Conclusion
Upgrading your production schedule does not have to break the bank, and can be accomplished with a simple Microsoft Excel spreadsheet. Once you identify the key areas to track and populate your tracker, your work is not done. Be aware that you will rarely get it all right the first pass and will have to adjust schedule times and processes tracked. This is a "living document" that should be change constantly as your business changes and grows.