We've all seen control charts used for statistical process control at some point in our careers. Every Six Sigma black belt you've ever met can rattle off their usefulness in controlling variation in manufacturing processes.
So why not apply them to control variation in other areas of your business? And what area of a job shop has more variation than it's product mix?
A control chart (also called swimlane map or run chart) is used to show how a process changes over time, and warns when processes become "out of control". Changes are made, and the process is brought back into control. We are going to do the same thing with our product mix, measuring our plant capacities against our bottlenecks, and adjusting the schedule or backlog when our bottlenecks become out of tolerance.
I've put together a very simple process of analyzing your product mix in your job backlog, so let's get started.
Introduction To The Product Mix Control Chart
The premise of the Product Mix Control Chart, or Mix Sheet as I like to call them, is very simple: exam your backlog for bottlenecks that are going to affect delivery.
To accomplish this, we need to:
- Have a good understanding of what the bottlenecks are in your operation. These can be machine limitations, manpower, shipping, whatever affects your business. If you need more insight I have an article on bottlenecks to help you.
- Understand what the limitations of these bottlenecks are - for example, Machine X can run 25 parts in a day, or Y department can work 220 hours a day.
- Have a backlog that goes out at least a week, but a month or quarter is better. It can be used on shorter time frames, but it is hard for most organizations to adjust without a little time to prepare once a problem is found.
- Have a production tracker gantt chart that will give you dates when product will be in each bottleneck
- You can break this down into individual departments, cells, or use the plant as a whole
Build A Simple Excel Sheet Example
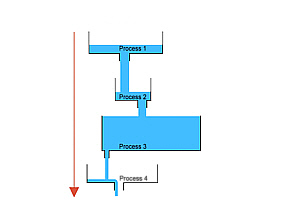
Let's do an example. Let's same XYZ is a company that manufacturers and repairs sanitary stainless tanks used on haul liquid food products on trucks. They run 10 jobs a week, and there are a full 5 working days in the week we look at.
The key bottlenecks in their operations are:
- Tig Circumference welding the stainless internal bottle heads of the tanks, of which they can do 3/day. Each complete tank has 2 heads
- Mig welding the mild steel cradles underneath, which they can do 3/day. Each tank has one cradle to support it.
- Manufacture small cradle gusset parts, which they can do 160/day.
- A new tank will require all processes, but a repair job will only require select resources
So let's build an excel spreadsheet with each individual job and a description of it. The I add a column for each of my bottlenecks and how many parts/processes must be completed on that job. Finally, I insert a column for each bottleneck showing the date it must be complete through that process, per my production schedule. The results are below, or download the Excel file
Analyze Weekly Data
First let's analyze the data for the week. Simple math will tell us we have an issue.
160 Gusset Parts/day x 5 days = 800/week (952 required this week)
3 Cradle Welds/day x 5 days = 15/week (12 required this week)
3 Bottle C-welds/day x 5 days = 15/week (15 required this week)
Oviously we are in trouble on gusset parts as we have to produce 152 more than we are capable of. We will have to either work OT the weekend before or re-arrange the schedule with the customer.
Another option would be to borrow labor from the cradle welding area this week as they are under-booked by roughly 1 days worth of labor, which coincidentally is the shortfall in the parts area. If the departments are roughly the same size, you could do a swap to limit this effect. This is a perfect illustration of why cross training is so important in a job shop.
We should be ok in the Bottle C-welding, assuming there are no issues.
Analyze Daily Data
This is where an extremely simple control chart will come in handy.
Let's start with our problem child from the last example, gussets:
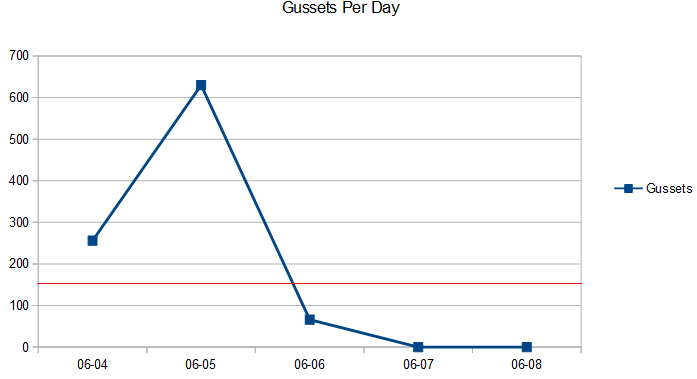
As you can plainly see, we are not only booked for the week, but we are well outside our control limits the first two days of the week, amplifying the problem.
Again countermeasures will have to be put in place in the form of rearranging the schedule, outsourcing, or moving around labor.
Now let's take a look bottles:
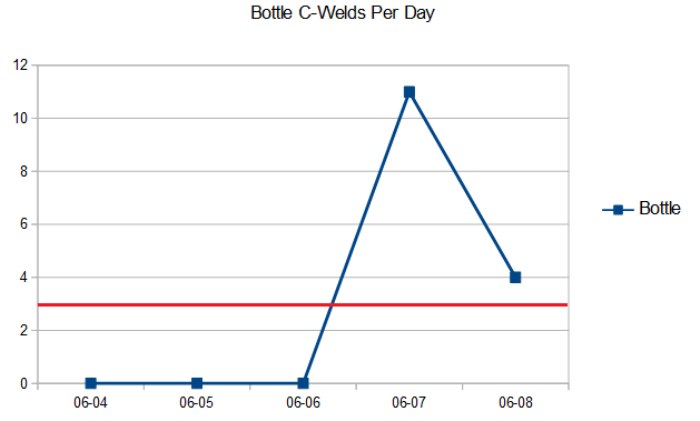
Here is the welding cradles chart:
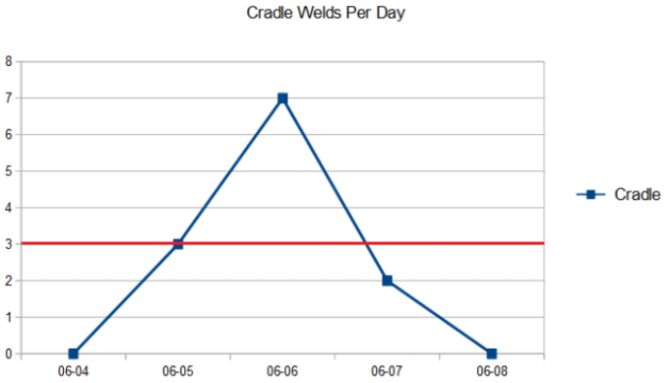
Just like the gussets, both of these areas are outside our control limit and overbooked on individual days as well, with the Cradle Welding area overbalanced midweek, and bottle C-welding later in the week.
Overall Analysis
The situation that arose in this example is a very common within made-to-order and job shop organizations. Some conclusions we can draw from this are:
We often schedule our plants based on capacity for the whole plant or department, yet as this example shows, we really need to focus on our bottlenecks as well. If you looked at the overall hours available to work in the plant that week, we should have been fine every day. But when we examined things more closely with a control chart, we were actually overbooked every day somewhere that week.
Don't just focus on manufacturing bottlenecks with this process. Office functions including order entry, materials, engineering and drafting, quality inspection, and transportation all potential areas that could benefit from this type of analysis. This should be included as part of your organizations broader SIOP process.
Experienced supervisors, managers, and schedulers will often catch situations like when it reaches the shop floor, which is too late. We should be mapping our schedule mix as far out as we can in advance to mitigate issues. It is much easier to adjust your schedule months in advance than it is while the product is on the shop floor.
If ever you needed an example of how cross training and flexible work stations could help a job shop, this was it. If you had the capability to run most of your labor (and the stations to do it) in gussets early in the week, cradles mid-week, and bottle C-welding later in the week you could eliminate most of this issue, even if it was identified late.
You should publish data like this to the shop floor, both in the form of raw excel spreadsheets and charts. It will help your workers understand the variation that they deal with every day, and why being flexible with work assignments is key. Also they will be surprise you by finding additional trends and solutions if you involve them in the process.
You should archive this information as well. It is invaluable for future continuous improvement events, is a valuable tool for marketing to understand the product they sell, and can even be used as justification for equipment purchases and expansion.
Conclusion
The example I provided is very simple and just scratches the surface of product mix issues present in most job shops. You can create much more complex statistical process control models than this, and apply more powerful standard deviation and statistical tools to the process.
Hopefully this example will help spark debate in your organization about how to manage variation in your product mix, and I'd love to hear your suggestions and success stories on this topic.